
If your monthly board report takes three days to compile, you aren’t managing a dental group; you’re reading a history book. Most DSOs operate in a state of permanent data lag, where fragmented practice management systems create silos that hide the true health of the estate. Effective DSO data aggregation and analysis is no longer a luxury for the IT department. It is the only way to identify which chairs are cold and which practices are bleeding production time at any given moment.
You know the frustration of trying to compare two locations when their reporting logic simply doesn’t align. It’s impossible to drive growth when you can’t trust the numbers on your screen. This guide shows you how to transform that fragmented data into a centralised engine for capacity optimisation and chair utilisation. We will explore how to achieve real-time visibility across every site, standardise KPIs for every manager, and lower FTA rates across your entire estate without the need for a single PMS migration.
Key Takeaways
- Eliminate data silos by centralising fragmented information from disparate practice management systems into a single source of truth for group-wide performance.
- Use standardised DSO data aggregation and analysis to compare chair utilisation and FTA rates across all locations using uniform operational definitions.
- Optimise capacity without the risk of a full PMS migration by deploying a technical layer that works alongside your existing software infrastructure.
- Shift from passive reporting to active capacity recovery by using real-time dashboards to automate patient outreach and refill short-notice cancellations.
The Challenge of Fragmented Data in Multi-Site Dental Groups
Most dental groups grow through rapid acquisition, inheriting a patchwork of legacy systems and inconsistent data entry habits. This creates a “Data Silo” problem where each practice operates as an isolated island of information. Practice managers often spend hours manually extracting spreadsheets that are outdated the moment they reach the executive team. This operational lag leads to missed production opportunities because it’s impossible to fix a gap that isn’t visible in real-time. Without sophisticated DSO data aggregation and analysis, group leaders struggle with poor dental capacity management across the entire estate.
Why Traditional Reporting Fails DSOs
Traditional end-of-month reports only show what was lost; they don’t help you save it. Relying on retrospective data means you’re constantly reacting to historical failures rather than preventing future ones. Scheduling based on a “gut feeling” of busyness is inherently inaccurate and leads to wasted staff resources. Data-backed capacity planning is the only reliable way to ensure every provider’s diary is optimised for maximum clinical output.
The Cost of Invisible Chair Time
Unmonitored gaps in hygiene and associate schedules represent a massive, compounding financial leak for multi-site groups. When a short-notice cancellation occurs and remains unfilled, that potential revenue is gone forever. Invisible chair time is the lost revenue from unfilled cancellations that could have been recovered with better visibility. To solve this, DSOs require a centralised data layer that sits above the existing Practice Management System. This layer standardises performance metrics and enables proactive intervention without requiring a disruptive and costly PMS migration.
Key Metrics for DSO Data Aggregation and Analysis
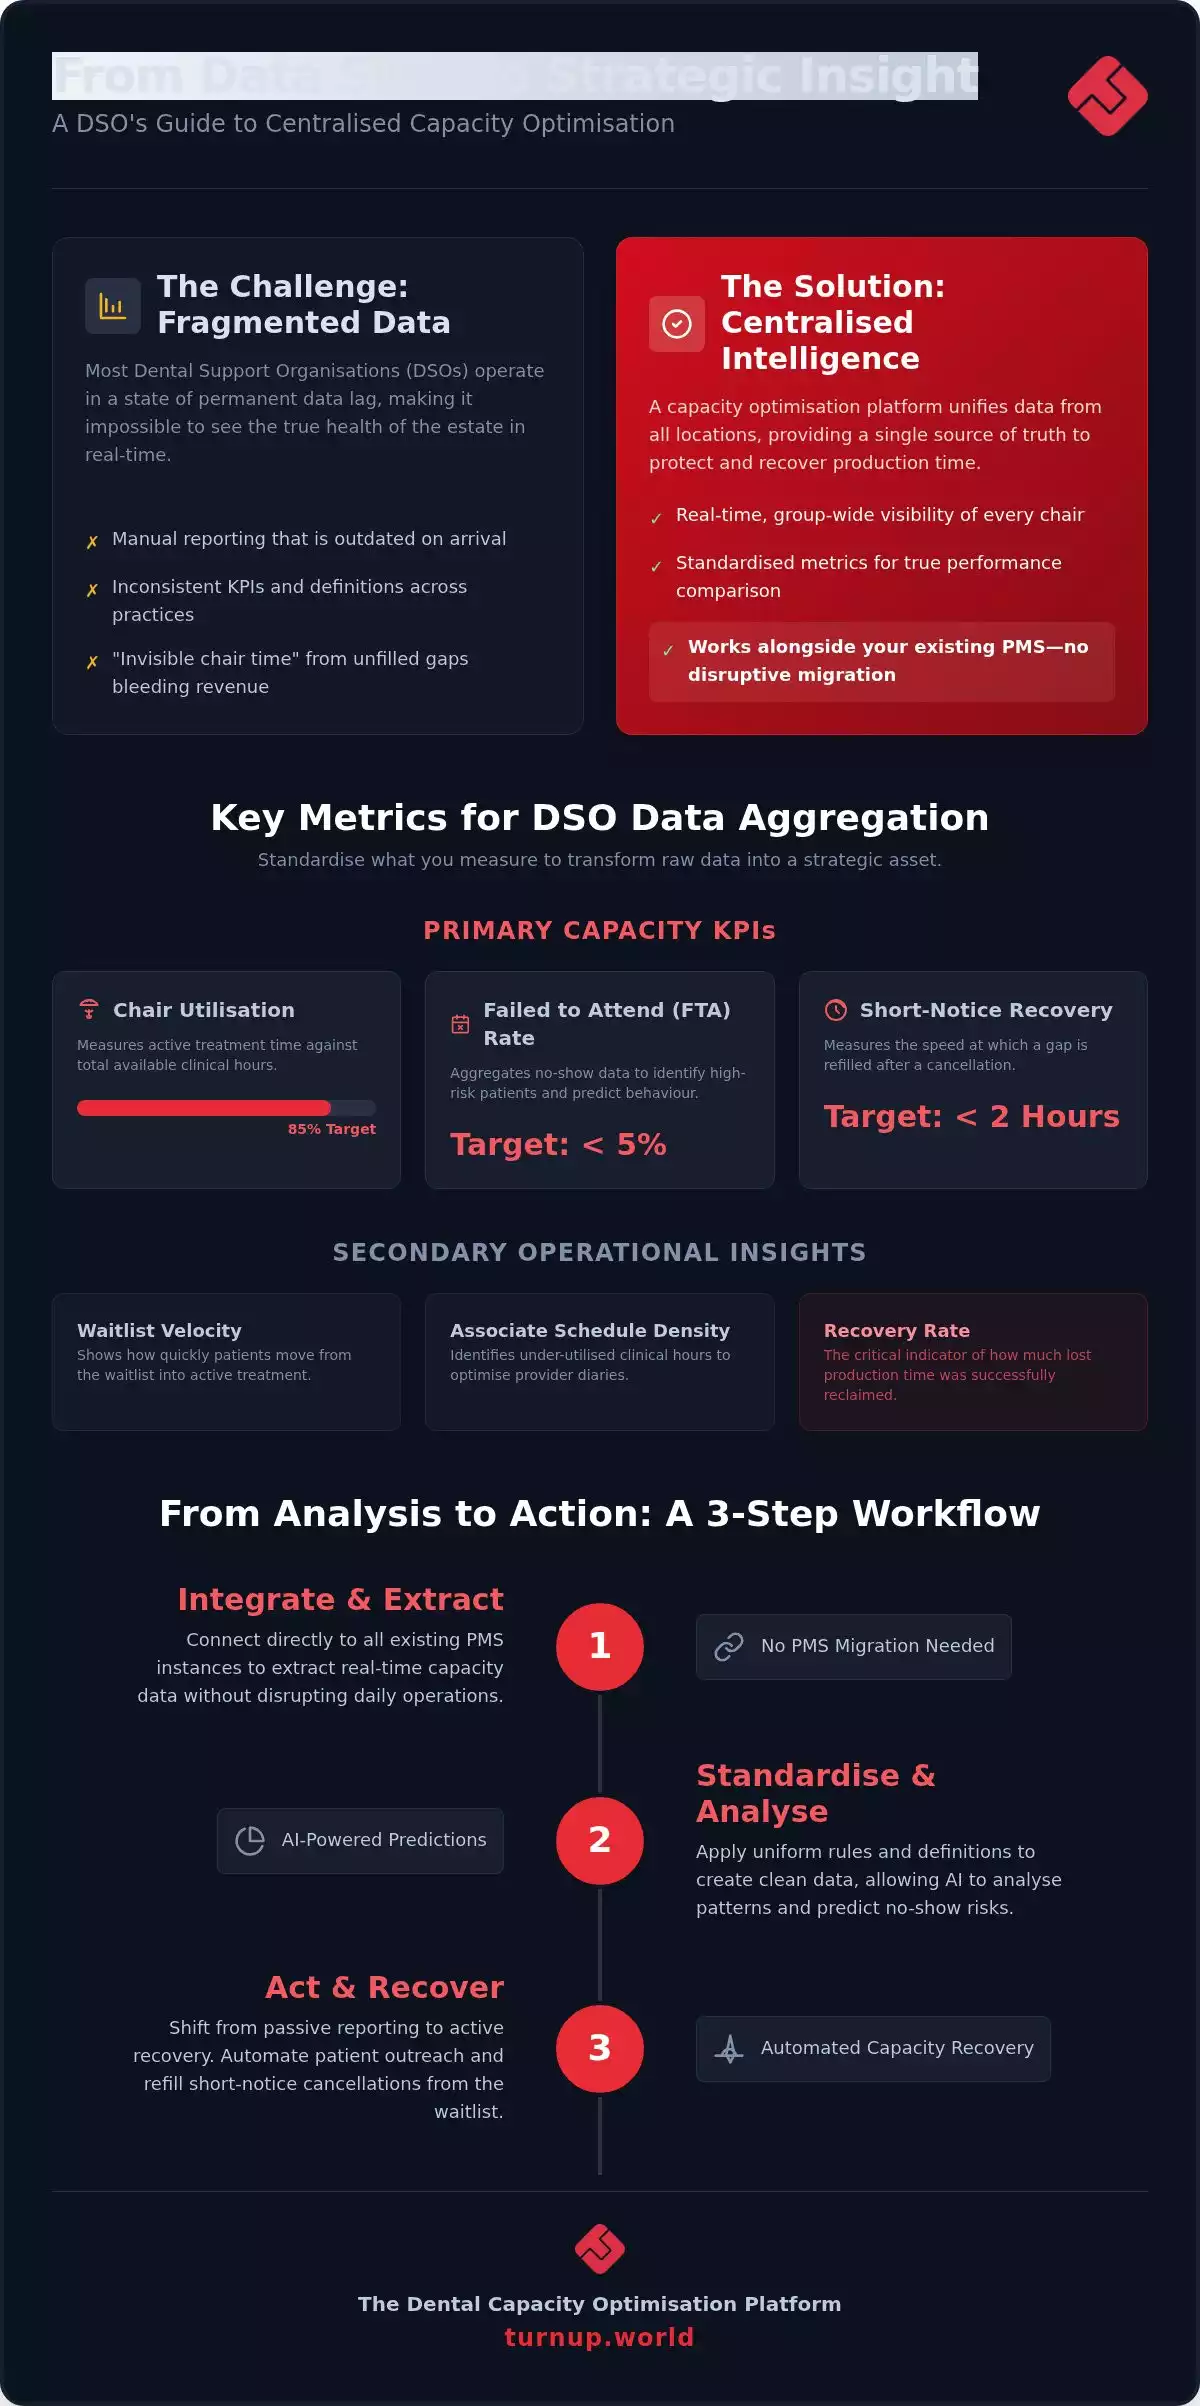
To transform raw data into a strategic asset, you must first standardise what you measure. Inconsistent definitions across practices lead to skewed group-wide results. Effective DSO data aggregation and analysis requires a uniform rulebook. For instance, if one practice defines an FTA differently from another, your central dashboard is effectively useless. You can determine your group’s current standing by assessing your Dental Capacity Maturity Level to benchmark performance accurately.
Primary Capacity KPIs
Your primary KPIs should focus on the immediate health of the clinical diary. Chair Utilisation Percentage measures active treatment time against total available clinical hours, revealing the gap between theoretical and actual revenue. The Failed to Attend (FTA) Rate is equally vital. By aggregating no-show data, you can identify high-risk patient cohorts and predict future no-show behaviour across different demographics. Finally, Short-Notice Recovery Time measures the speed at which a gap is refilled after a cancellation, serving as the ultimate test of your operational agility.
Secondary Operational Insights
Beyond the basics, DSOs should track Waitlist Velocity. This shows how fast patients move from the waitlist into active treatment. Additionally, Associate Schedule Density helps identify over-booked or under-utilised clinical hours, ensuring your highest earners are always productive. The most critical metric for group leaders is the Recovery Rate. This acts as a primary indicator of front desk efficiency, showing exactly how much lost production time was successfully reclaimed. To see how these metrics look in a live group dashboard, you can explore the TurnUp capacity platform to visualise your estate’s performance.
Building a Centralised Data Analysis Workflow
Manual spreadsheets are the enemy of scale. Moving from fragmented reporting to a real-time dashboard requires a workflow that prioritises data integrity at the source. This transition begins by standardising procedures across dental practices to ensure every site records appointments and cancellations identically. Clean data is the prerequisite for effective DSO data aggregation and analysis. Once your data is standardised, AI can analyse historical patterns to predict no-show risks before they occur. This enables centralised teams to manage scheduling for multiple locations remotely, intervening where capacity is most at risk.
Step 1: PMS Integration and Data Extraction
Attempting a group-wide PMS migration is often a multi-year, high-risk project that stalls operational progress. You don’t need to change your software to gain visibility. TurnUp integrates directly with your existing PMS instances to extract real-time capacity insights without disrupting daily clinical workflows. This creates a unified data layer that bypasses the limitations of legacy software, providing a reliable engine for growth that works alongside your current tools.
Step 2: Normalising Data Across Locations
The biggest hurdle in DSO data aggregation and analysis is the lack of uniformity in appointment codes. One practice might use “EXAM” whilst another uses “CHK”. A centralised workflow maps these disparate codes to a single, unified “Capacity Index”. This allows for a fair, like-for-like comparison between practices regardless of their individual setup or location. By normalising this data, group leaders can identify top-performing sites and apply those lessons to under-utilised locations with surgical precision. To begin building your centralised dashboard and recover lost production time, integrate TurnUp with your existing PMS today.
From Analysis to Action: Optimising Group Capacity
Data alone doesn’t fill chairs. The true value of DSO data aggregation and analysis lies in the transition from passive observation to automated intervention. Most groups fail here; they identify a capacity leak but lack the manual bandwidth to plug it. By integrating a capacity optimisation layer, you move beyond reporting and into active recovery. This shift ensures that every insight generated by your data leads directly to a filled appointment and recovered clinical time.
Automating the Recovery Workflow
The TurnUp Front Desk Copilot uses aggregated data to trigger surgical patient outreach without human input. Instead of calling every patient, the system uses predictive analysis to identify high-risk appointments. If the model predicts a high no-show probability, the AI Call Centre initiates a confirmation or rebooking sequence. When a cancellation occurs, the automated waitlist manager instantly contacts the most suitable patients to refill the gap. This recovered time is pure margin. It requires zero reception effort and prevents the “invisible chair time” that erodes group profitability.
Empowering the Centralised Scheduling Team
Centralised operations managers need a single pane of glass to monitor the entire estate. This bird’s-eye view allows leaders to see which practices are successfully recovering time and which need operational support. Standardising these workflows across every site, without the friction of a PMS migration, transforms scheduling from a local headache into a group-wide competitive advantage. Optimising chair utilisation by even 3 per cent across a multi-site group has a compounding effect on EBITDA. It’s the difference between a DSO that merely survives and one that scales with surgical precision. To move from manual reporting to automated capacity optimisation, start by connecting your disparate systems to a unified data layer.
Scale Your Group Operations With Data-Driven Precision
Data silos don’t have to be the status quo for your dental group. By implementing robust DSO data aggregation and analysis, you transition from reactive reporting to proactive capacity recovery. Standardising KPIs across your estate and normalising appointment codes provides the visibility needed to protect your clinical hours. The most successful groups move beyond just looking at numbers; they automate the response to them.
TurnUp provides the technical layer to make this happen without a disruptive PMS migration. You can predict no-show risk with AI, automate short-notice cancellation recovery, and monitor every location through unified DSO dashboards. It’s time to stop losing production time to fragmented systems and start treating your schedule as a high-performance engine. Book a demo of the TurnUp capacity optimisation platform to see how you can secure your group’s clinical output today.
Frequently Asked Questions
What is the difference between reporting and data aggregation in a DSO?
Reporting typically involves looking at historical performance for a single location in isolation. In contrast, DSO data aggregation and analysis pulls disparate information from every practice into a unified dashboard. This allows leaders to identify patterns across the entire group rather than reacting to individual site fluctuations. Aggregation transforms fragmented data into a strategic asset, enabling group-wide capacity optimisation and more accurate production forecasting across the estate.
Can we aggregate data if our practices use different practice management systems?
You can aggregate data across multiple platforms without undergoing a costly and disruptive PMS migration. Modern capacity optimisation platforms like TurnUp are designed to sit above your existing software, pulling real-time insights from different systems simultaneously. This technical layer normalises the data, mapping different appointment codes and clinical workflows to a single source of truth. It allows for fair performance comparisons between practices regardless of their legacy software setup.
How does data analysis help in reducing dental no-shows?
Data analysis identifies the specific patient behaviours and demographics that lead to failed appointments. By aggregating historical no-show data, AI models can predict the probability of an FTA before it occurs. This foresight allows centralised teams to trigger automated outreach or AI-driven confirmation calls for high-risk slots. Instead of generic reminders, the system focuses resources on protecting the most vulnerable parts of the clinical schedule to keep chairs filled.
Do we need to hire a data scientist to manage DSO data aggregation?
You don’t need a dedicated data scientist to manage your group’s information. The right capacity optimisation platform automates the heavy lifting of data extraction and normalisation. Operations managers can access pre-built, intuitive dashboards that present actionable insights without requiring technical expertise. This empowers your existing team to make data-driven decisions about chair utilisation and scheduling efficiency without needing to write code or manage complex databases manually.
What is the most important metric for measuring dental group efficiency?
Chair utilisation is the primary metric for measuring group efficiency, as it tracks active treatment time against available clinical hours. However, for DSOs focused on growth, the recovery rate is equally vital. This measures how effectively your team refills short-notice cancellations from the waitlist. Tracking these metrics through centralised DSO data aggregation and analysis ensures you have a clear view of where production is being lost and reclaimed.