A visible gap in your dental chair diary isn’t just an empty slot. It’s a decaying asset costing your DSO thousands in unrecovered overhead every hour. You’ve likely seen the friction caused by inconsistent data between practice sites. Manual spreadsheet tracking creates administrative burnout while high overheads persist alongside those quiet clinical bays. It’s a reactive cycle that prevents true scale.
You need a standard, data-driven approach to stay ahead. This guide provides the definitive 2026 framework on how to calculate dental chair utilisation rate with surgical precision. You’ll master the exact formulas and benchmarking strategies needed to quantify clinical capacity and eliminate revenue leaks across your entire dental group. We’ll move from basic manual math to advanced DSO benchmarks. We’ll also explore how to identify underperforming clinics and automate the entire measurement process. It’s time to stop guessing and start optimizing your group’s most valuable asset.
Key Takeaways
- Quantify clinical capacity using the 2026 formula for how to calculate dental chair utilisation rate to expose hidden revenue leaks across your group.
- Recognise the “Idle Chair Tax” as the primary driver of DSO overhead and why empty surgeries are your most expensive assets.
- Implement a 75% utilisation benchmark to isolate underperforming sites and standardise reporting for board-level oversight.
- Transition from manual spreadsheet tracking to automated capacity management to eliminate data lag and administrative burnout.
- Leverage the TurnUp Front Desk Copilot to proactively fill gaps and protect clinical efficiency through automated no-show prevention.
Why Chair Utilisation is the Primary Metric for Dental Group Profitability
Dental chair utilisation is the definitive ratio of revenue-generating treatment time against total clinical capacity. It isn’t just a diary metric; it’s the pulse of your DSO’s operational health. Knowing how to calculate dental chair utilisation rate allows you to see past the busywork of a front desk and into the actual profitability of each surgery. While other KPIs track patient volume—often measured at the door via footfall.au—this metric tracks the efficiency of your most expensive asset.
Every minute a chair sits empty, you pay the “Idle Chair Tax.” Unlike variable costs, your fixed overheads; rent, utilities, and clinical staff salaries; don’t stop when the patient doesn’t show up. In a DSO, an empty surgery is the highest fixed cost you carry. Maximizing this metric is the most direct path to expanding EBITDA and increasing group valuation. Investors look for optimized capacity rather than just busy clinics. High utilisation proves that your infrastructure is delivering maximum return on investment.
The Financial Impact of Lost Capacity
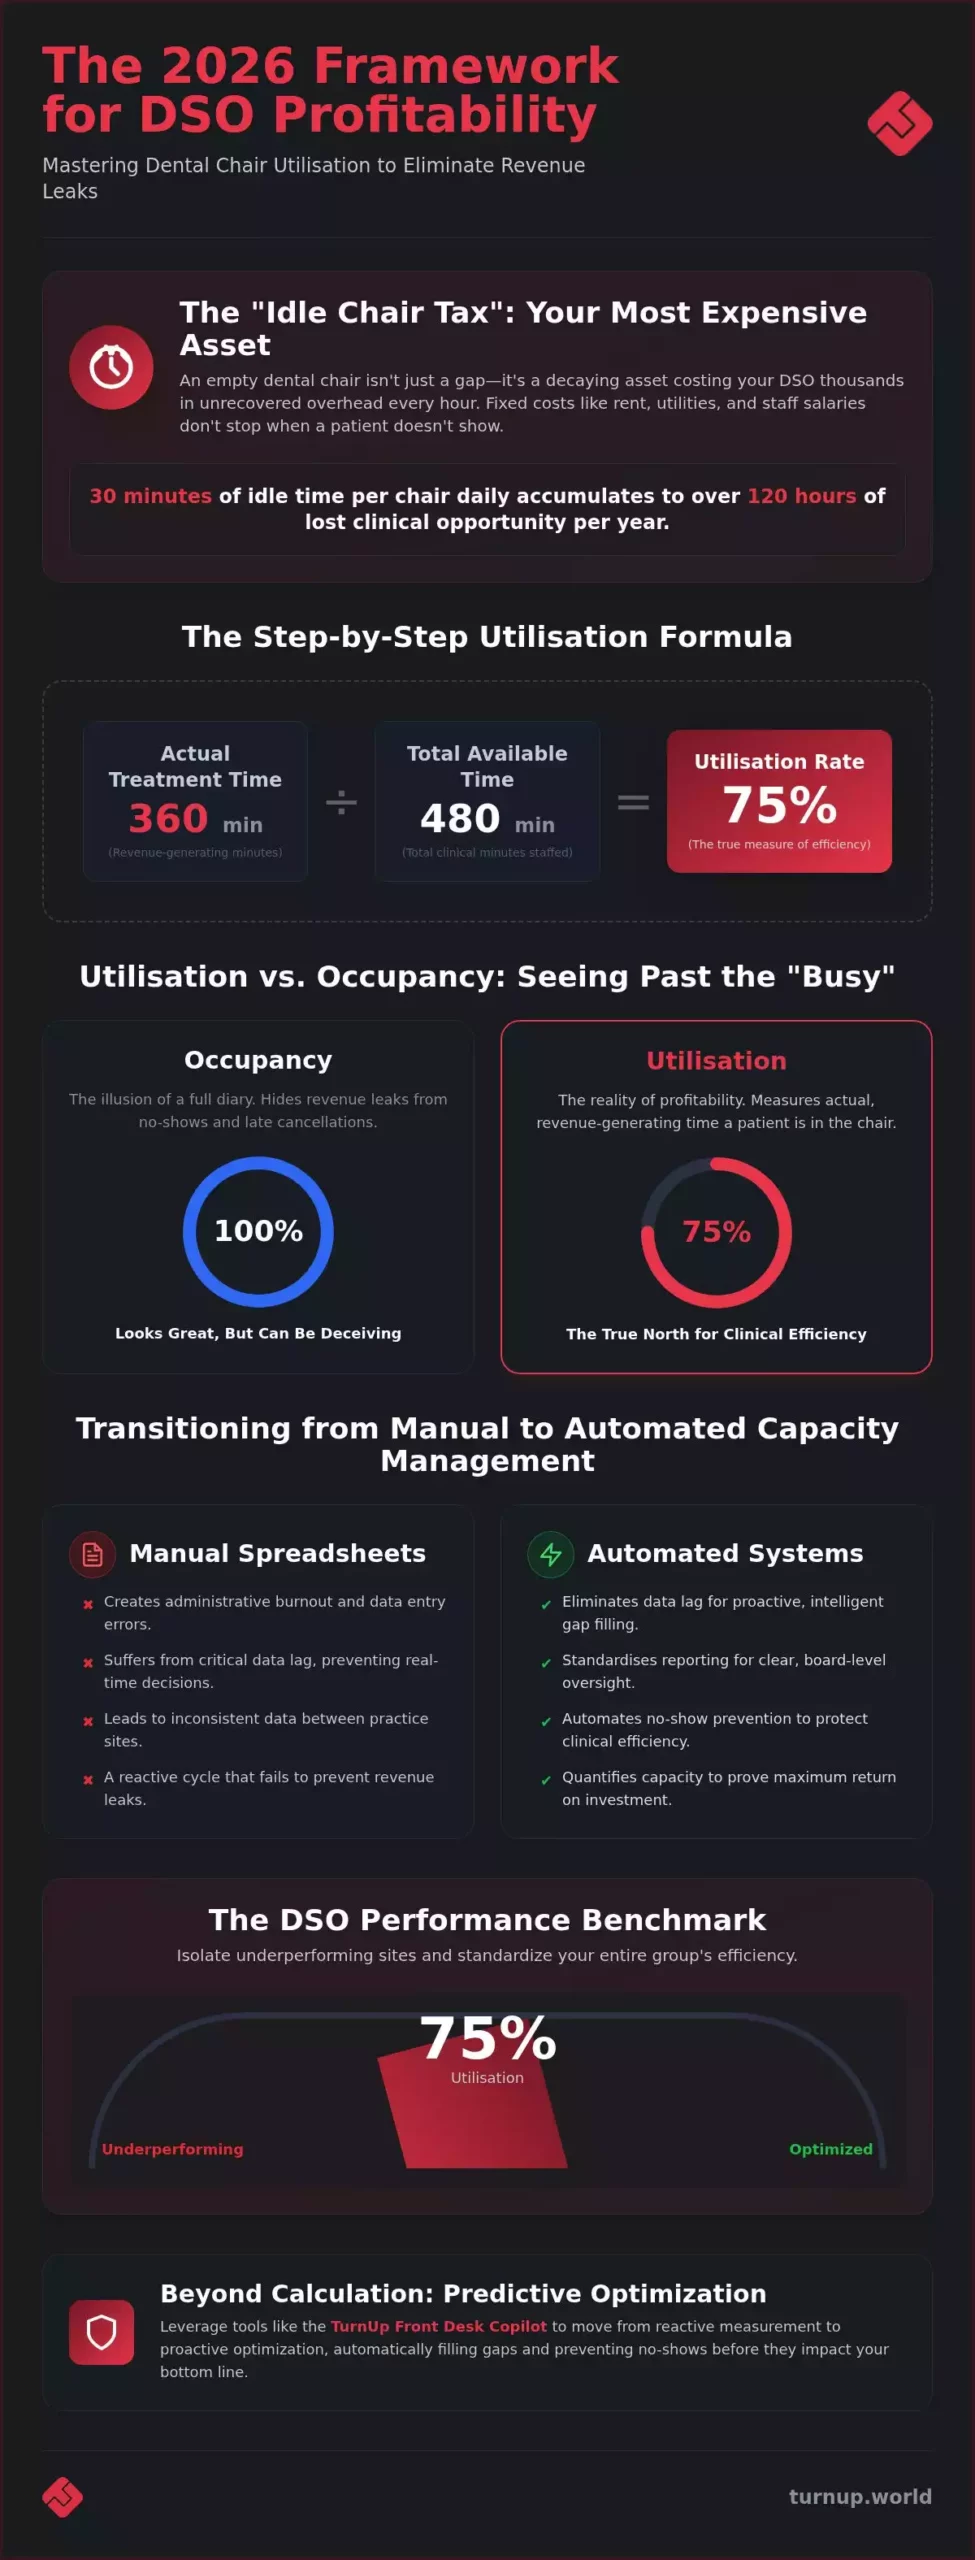
The math of lost time is brutal. Consider a single chair losing just 30 minutes of idle time per day. Over a standard working year, this adds up to over 120 hours of vanished clinical opportunity. For high-overhead private treatments, this “white space” doesn’t just reduce profit; it can turn a profitable day into a loss-making one. You can find more detail on managing these margins in our how to improve DSO profitability guide. Consistent underutilisation erodes the scalability of your entire group and weakens your market position.
Utilisation vs. Occupancy: Why the Difference Matters
Occupancy tells you the diary is full. Utilisation tells you if you’re actually generating revenue. A clinic can boast a 100% booked diary but still suffer a 70% utilisation rate. This gap is usually caused by DNA (Did Not Attend) events or late cancellations that leave chairs cold while staff costs continue to accrue. Reporting on occupancy alone is dangerous because it hides systemic revenue leaks behind a facade of “busyness.” True clinical efficiency requires looking at actual revenue-generating minutes. If your team spends hours on admin blocks or dealing with short-notice gaps, your occupancy looks great, but your utilisation is failing. Identifying this distinction is the first step toward proactive capacity optimization.
The Step-by-Step Formula to Calculate Dental Chair Utilisation
DSOs often struggle with data fragmentation. One site might count emergency blocks as utilised, while another sees them as dead time. To achieve group-wide transparency and operational excellence, you must follow a rigid, four-step process that removes ambiguity from your clinical reporting.
Defining Your “Available Time” Baseline
Available Time is the total clinical minutes a chair is physically capable of being utilised. This baseline must remain consistent regardless of site-specific opening hours or varied clinician shift patterns. If Surgery 1 is open 40 hours and Surgery 2 is open 32 hours, your calculation must reflect these individual constraints before aggregating group data. Emergency blocks present a common dilemma. We recommend including them in your “Available Time” baseline. If the chair is staffed and ready, it’s capacity. If it’s not filled with a patient, it’s a gap. Standardising this definition prevents clinics from “hiding” underutilisation within administrative blocks.
Once your baseline is set, move to quantifying “Actual Treatment Time”. This includes only revenue-generating minutes where a patient is in the chair. You must exclude lunch breaks, staff meetings, and pre-blocked administrative time. If a clinician is onsite but the surgery is not booked for a patient, that time is not utilised. This distinction is vital for understanding how to calculate dental chair utilisation rate accurately across diverse clinical teams. The core calculation is straightforward: (Actual Treatment Time / Available Time) x 100. For example, if a surgery is available for 480 minutes and performs 360 minutes of treatment, the utilisation rate is 75%.
To make this data actionable for board-level reporting, you must standardise the collection period. Weekly reporting allows for agile adjustments to front-desk behavior, while monthly reporting provides the high-level trends needed for long-term strategy. Consistent tracking across these windows reveals which sites are operational leaders and which are lagging behind the group average.
Calculating the Cost of Lost Clinical Capacity
A percentage gap is abstract; a revenue loss is not. To translate your findings into financial impact, multiply the idle minutes by your average hourly surgery rate. Factoring in the “No-Show factor” is also essential. If your utilisation is 80% but 5% of your “actual” time was lost to DNAs that weren’t rebooked, your real-world efficiency is lower. You can use these insights to build a compelling business case for dental practice automation. Automating the measurement process ensures your data remains objective and free from human error. If you want to eliminate these manual calculations entirely, exploring automated capacity tools is the logical next step for your group.
Manual Spreadsheets vs. Automated Capacity Management
Manual tracking is a relic of the past. Many DSOs still fall into the “Spreadsheet Trap” when trying to understand clinical performance. This method is fundamentally flawed. Manual data entry is slow. It is prone to human error. By the time a regional manager reviews a spreadsheet, the data is already a week old. You cannot fix a gap that occurred last Tuesday. This data lag creates operational uncertainty that prevents rapid scaling and leaves revenue on the table.
Administrative burnout is the hidden cost of this manual approach. Your front desk team should focus on patient care and experience. Instead, they spend hours every month wrestling with data exports and manual tallies. This is a poor use of human capital. It turns skilled receptionists into data entry clerks. In the fast-paced 2026 market, this inefficiency is a major competitive disadvantage. Real-time visibility is no longer a luxury; it’s a requirement for survival.
The Limitations of Traditional PMS Reporting
Practice Management Software (PMS) is designed for records, not optimization. Most built-in reports are reactive. They tell you what happened in the past but offer no help for the future. PMS data often requires extensive manual “cleaning” before it is useful for board-level reporting. You must filter out non-clinical blocks and adjust for varied shift patterns manually. While standardising procedures across dental clinics reduces some reporting friction, it doesn’t solve the lack of predictive insight. If you are still trying to figure out how to calculate dental chair utilisation rate using only basic PMS exports, you are seeing an incomplete picture. You lack the foresight to fill gaps before they happen.
The Shift Toward Automated Capacity Optimization
Automated platforms represent the logical evolution of dental group management. These systems pull data directly from the diary without human intervention. There is no manual cleaning. There is no data lag. For a DSO regional manager, this provides a single source of truth across all sites. You can compare clinic performance instantly from a central dashboard. It eliminates the “he-said, she-said” nature of manual site reporting.
The real value lies in the transition from historical reporting to live capacity monitoring. You don’t just see that you had a 70% utilisation rate last month. You see that you have a capacity gap opening up next Wednesday. Automated systems allow you to be proactive. They identify the problem and trigger the necessary actions to solve it. This level of visibility is the only way to maintain peak clinical efficiency across a modern dental group.
Interpreting the Data: Benchmarking Your Multi-Site Performance
Raw data is just noise without context. Once you’ve mastered how to calculate dental chair utilisation rate, you must apply rigorous benchmarks to differentiate between peak performance and operational decay. In the 2026 DSO landscape, a healthy utilisation rate sits at 85%. This level allows for clinical precision without overstretching your clinicians or compromising patient safety. If you’re still refining how to calculate dental chair utilisation rate manually, you’ll likely miss the subtle site-to-site variations that signal a management crisis.
Any clinic falling below the 75% “Danger Zone” requires immediate intervention. At this level, fixed overheads aggressively consume your margins. Peer-to-peer benchmarking is your most powerful diagnostic tool. If Site A maintains 88% while Site B struggles at 65%, the issue isn’t market demand. It is operational execution. This comparison allows regional managers to transfer successful protocols from high-performing sites to those in the danger zone. It creates a culture of accountability based on objective clinical output rather than anecdotal reports. This data is also critical for how to increase dental practice valuation. High utilisation directly translates to stronger EBITDA and higher acquisition multiples.
Identifying Underperforming Clinics
Watch out for “Phantom Capacity”. These are clinics that appear busy on the surface but suffer from low revenue-generating utilisation. This often points to high DNA rates or inefficient block management. If a site consistently misses the DSO benchmark, managers must audit the gap-filling process immediately. High no-show rates are the most common cause of this discrepancy. When a site falls below the benchmark, the first step is to quantify the “No-Show factor” and implement automated rebooking protocols. Data doesn’t lie. It exposes truth.
Using Data to Drive Clinical Output
Stop incentivising front desk teams based on “calls made” or “hours worked”. Instead, tie performance to utilisation targets. This focuses the team on high-value activity that protects the clinical diary. Optimising a dental appointment schedule is the primary lever here. By aligning team incentives with chair utilisation, you turn your reception into a proactive revenue engine. Crucially, sustained high utilisation (90%+) is your signal to recruit. It proves you have the demand to support a new clinician without diluting current returns. To see where your sites stand against these 2026 benchmarks, book a capacity audit with TurnUp.
Beyond Calculation: Using TurnUp Front Desk Copilot for Predictive Optimization
Knowing how to calculate dental chair utilisation rate is the foundation. However, measurement alone is reactive. It tells you what you lost, not how to keep it. The TurnUp Front Desk Copilot shifts the focus from historical reporting to predictive optimization. It’s the difference between reading an autopsy and providing a cure. This platform automates the entire capacity lifecycle. It identifies risk, prevents gaps, and fills unavoidable cancellations without human intervention.
The LastMinute solution eliminates the need for frantic receptionist phone calls. When a gap appears, the system identifies the best patient to fill it and handles the rebooking process. This ensures your utilisation rate stays protected even during high-volatility periods. You move from measuring the problem to solving the capacity gap automatically. It turns your diary into a self-healing asset.
Automating No-Show Prevention
TurnUp uses predictive AI to identify high-risk appointments before they become empty chairs. By analyzing historical patient behavior, the system flags likely DNAs and intervenes early. This proactive approach is central to reducing no-shows across your entire group. It directly improves your utilisation percentage by keeping clinical time revenue-generating. TurnUp eliminates the need for manual confirmation calls by managing patient communication through automated, intelligent workflows.
The Future of DSO Capacity Management
Scaling clinical output across 50+ sites requires a centralised capacity engine. You cannot rely on 50 different practice managers to calculate and optimize their diaries manually. The most profitable DSOs in 2026 have moved away from manual scheduling in favor of algorithmic precision. They treat capacity as a group-wide asset rather than a site-specific burden.
This transition removes the administrative weight from your front desk. It allows them to focus on high-value patient interactions while the technology protects the clinical diary. If you’ve spent years trying to figure out how to calculate dental chair utilisation rate across inconsistent sites, it’s time to automate the answer. The TurnUp Front Desk Copilot provides the real-time visibility and proactive action needed to maintain peak performance. Your next step is to see the platform in action. Booking a demo of the TurnUp Front Desk Copilot will show you how to turn these calculations into consistent, automated revenue.
Scale Your DSO with Data-Driven Precision
Mastering how to calculate dental chair utilisation rate is the first step toward operational mastery. You’ve moved from inconsistent site data to a standardised formula that exposes hidden revenue leaks. By identifying the “Danger Zone” below 75% and establishing 2026 benchmarks, you now have the visibility needed to drive group-wide growth. However, manual tracking remains a bottleneck that causes administrative burnout and data lag.
The most profitable dental groups have evolved beyond simple measurement. They use predictive automation to solve capacity gaps before they impact the bottom line. Trusted by leading UK DSOs, our technology offers AI-driven no-show prevention and seamless PMS integration to keep your surgeries productive. It’s time to eliminate the “Idle Chair Tax” for good. Optimise your DSO capacity with TurnUp Front Desk Copilot and take full control of your clinical output. Your path to a more efficient, automated future starts today.
Frequently Asked Questions
What is a good dental chair utilisation rate for a UK practice?
An 85% utilisation rate is the gold standard for UK practices in 2026. This level ensures clinicians aren’t overwhelmed while maintaining high profitability. Anything above 90% signals a need for recruitment to prevent burnout. Conversely, falling below 75% indicates significant operational failure. You must track this consistently across sites to identify which clinics are meeting these benchmarks and which require immediate management intervention.
How is chair utilisation different from practice occupancy?
Occupancy measures the percentage of the diary that is booked, while utilisation measures revenue-generating minutes actually delivered. A diary can be 100% occupied but only 70% utilised if patients fail to attend or if blocks are used for non-clinical admin. Utilisation is a more accurate metric for clinical efficiency. It exposes the “white space” that occupancy reports often hide, providing a clearer picture of your DSO’s financial health.
Can I calculate utilisation rates directly from my PMS?
Most Practice Management Systems offer basic reports, but they often require manual cleaning to be useful. You’ll need to manually filter out lunch breaks and non-clinical blocks to understand how to calculate dental chair utilisation rate accurately. Traditional PMS data is typically reactive and lacks the predictive insights needed for optimization. Specialised capacity platforms provide a more reliable, automated alternative by pulling live data directly from your group’s diaries.
How does a high no-show rate affect my chair utilisation calculation?
High no-show rates directly deflate your utilisation percentage by creating unrecovered gaps in the clinical diary. Even if your occupancy is high, a 5% no-show rate can push a clinic from a healthy 85% down to a sub-optimal 80%. This “No-Show factor” is a primary driver of lost revenue. Reducing these events is the fastest way to improve how to calculate dental chair utilisation rate results and protect your margins.
What are the most common causes of low chair utilisation in DSOs?
Low utilisation usually stems from three core issues:
- High patient DNA (Did Not Attend) rates.
- Inefficient block management for administrative tasks.
- Poorly managed clinician shift patterns.
Inconsistent front desk protocols across different sites often exacerbate these problems. Without a standardised framework, individual clinics may struggle with “Phantom Capacity,” where they appear busy but fail to generate revenue-generating minutes consistently.
How often should a dental group review its utilisation reports?
Review your reports weekly for tactical adjustments and monthly for strategic board-level oversight. Weekly reviews allow regional managers to spot underperforming sites and address bottlenecks before they become long-term trends. Monthly reporting provides the high-level perspective needed for recruitment planning and valuation assessments. Real-time visibility is the 2026 standard. Waiting until the end of a quarter to review capacity data is a recipe for missed revenue opportunities.
Does automated gap-filling actually improve the utilisation rate?
Automated gap-filling directly increases utilisation by rebooking short-notice cancellations without manual intervention. When a patient cancels, the system identifies a replacement instantly. This prevents the chair from sitting idle, which is the highest fixed cost in a DSO. By automating this process, you remove the administrative burden from your reception team. It ensures your clinical capacity is always working at its maximum revenue-generating potential.
What is the cost of an empty dental chair per hour in 2026?
An empty chair represents the total of your hourly fixed overheads plus lost clinical revenue. In the 2026 market, these fixed costs include clinician salaries, rent, and utilities that don’t stop when a patient fails to show. Every idle hour is an unrecovered expense that erodes your group’s EBITDA. Quantifying this “Idle Chair Tax” is essential for building a business case for capacity optimization and automated front desk tools.