You already know that fixed costs like rent, utilities, and staff salaries remain constant regardless of patient volume. It’s frustrating to watch profit margins erode because of a 15% to 20% no-show rate that your front desk feels powerless to stop. This guide promises to reveal the precise financial impact of idle surgery time and provides a clear formula to calculate your practice’s true capacity leakage. We will explore 2026 benchmark data, examine the indirect costs of scheduling chaos, and build a data-driven business case for modern capacity optimization.
Key Takeaways
- Identify “idle chair time” as the critical gap between scheduled clinical hours and actual utilization to expose hidden profit leaks.
- Use the Gross Hourly Loss formula and Revenue Per Hour (RPH) benchmarks to quantify the precise cost of an empty dental chair per hour.
- Leverage the “Capacity Multiplier” to transform minor individual clinic efficiencies into significant enterprise-level EBITDA growth across your DSO.
- Implement a proactive hierarchy of gap-filling that prioritizes automated prevention and high-velocity detection over outdated manual call lists.
- Optimize hourly ROI through real-time visibility and automated capacity management using the TurnUp Front Desk Copilot.
Understanding the Anatomy of an Empty Dental Chair
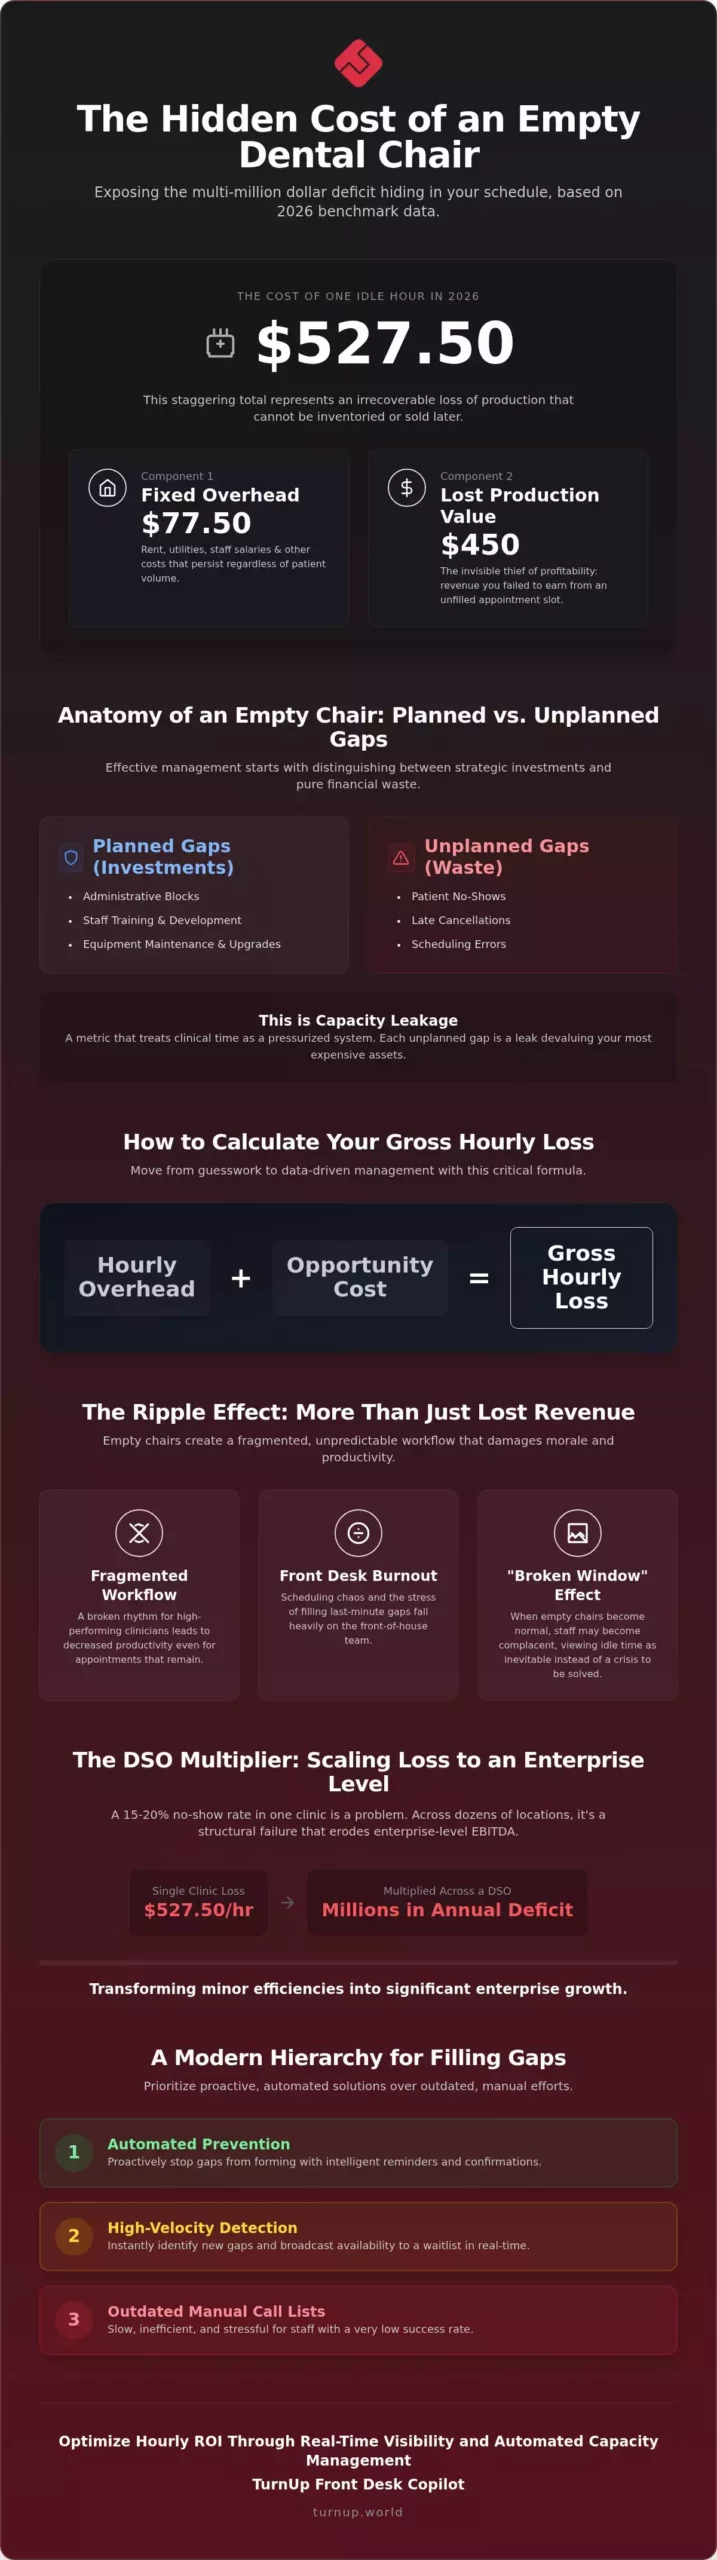
Idle chair time represents the critical gap between scheduled clinical hours and actual chair utilization. In high-performance dental service organizations, this isn’t just a scheduling hiccup; it’s a structural failure. While dentistry is a specialized branch of medicine, the business of running a clinic is a race against time. Every minute a surgery sits empty, the profit margin of the entire practice contracts. The cost of an empty dental chair per hour is the most aggressive drain on profitability because it represents an irrecoverable loss of production that cannot be inventoried or sold later.
To manage this effectively, clinical directors must distinguish between planned and unplanned gaps. Planned gaps include administrative blocks, staff training, or equipment maintenance. These are investments in the business. Unplanned gaps, such as no-shows and late cancellations, are pure waste. In 2026, forward-thinking DSOs have moved beyond simple “occupancy” to track “Capacity Leakage.” This metric treats clinical time as a pressurized system. Any gap in the schedule is a leak that devalues the practice’s most expensive assets: the clinician’s expertise and the surgery’s fixed infrastructure. To see how these assets can be optimized through high-value restorative care, you can explore Dental Implants.
Fixed Costs vs. Variable Savings
A common misconception in dental management is that an empty chair saves money on clinical materials and lab fees. This is a financial myth. While you might save a few pounds on composite resin or gloves, these variable costs are negligible compared to the massive fixed overheads. Rent, business rates, and insurance premiums persist whether a patient is in the chair or not. In the UK, staff costs are essentially fixed in the short term. You don’t send your dental nurses or receptionists home without pay just because a patient failed to arrive. The cost of an empty dental chair per hour remains high because your largest expenses are locked in, regardless of volume.
The Hidden Impact on Staff Morale
The damage extends far beyond the balance sheet. Empty slots create a fragmented, unpredictable workflow that frustrates high-performing clinicians. When a dentist’s rhythm is broken by a sudden cancellation, productivity drops even for the appointments that do remain. This chaos often falls on the front-of-house team, leading to significant stress. Understanding how to reduce dental receptionist burnout starts with stabilizing the schedule. Constant gaps also trigger a “broken window” effect. When empty chairs become a daily norm, administrative staff may become complacent about no-shows; they start to view idle time as an inevitable part of the job rather than a solvable business crisis.
The Math: Calculating the Hourly Cost of Inactivity
Quantifying the financial erosion of an idle surgery requires more than a glance at a monthly spreadsheet. You need a surgical approach to your data. To calculate the cost of an empty dental chair per hour, you must combine your fixed operational burn rate with your lost production potential. This total represents your Gross Hourly Loss. While the median annual wage for dentists provides a baseline for professional value, the true valuation of your clinical space is defined by Revenue Per Hour (RPH). We define Chair Time Value as the total potential revenue minus only variable material costs. If you haven’t calculated this for each surgery in your group, you’re managing by guesswork rather than data.
Step 1: Determining Your Hourly Overhead
Hourly overhead is your baseline burn rate. To find this, aggregate every annual fixed cost: rent, business rates, insurance, and non-clinical staff wages. Divide this total by the number of available clinical hours across all chairs. In 2026, you must also include equipment depreciation and rising energy costs specific to surgery operations. Even when a chair is empty, these costs remain active. You’re paying for the space, the lights, and the receptionist’s time whether the clinician is working or waiting. If your overhead is £80,000 per year for a single chair operating 1,600 hours, your base cost is £50 per hour before a single patient walks in.
Step 2: Factoring in Opportunity Cost
Opportunity cost is the invisible thief of DSO profitability. It represents the profit you failed to earn because a slot remained unfilled. If your average treatment value is £450 and that hour remains empty, your loss isn’t just the £50 overhead; it’s the full £450 you could have banked. This becomes exponentially more damaging during high-value blocks. An empty implant or orthodontic slot doesn’t just cost you the average rate; it costs you the premium production that drives your EBITDA. The cost of an empty dental chair per hour can easily double when high-margin procedures are missed. Associate pay structures also complicate this math. While you don’t pay an associate’s percentage on a no-show, you still lose the practice’s retained portion. This retained margin is what funds your group’s growth and covers your debt service. If your team struggles to quantify these losses in real-time, it’s worth looking at how to automate your capacity tracking to reclaim that lost revenue.
The DSO Multiplier: Scaling the Loss Across Organisations
Scale changes the nature of clinical waste. While a single clinic might absorb a 5% no-show rate as an unavoidable cost of doing business, a Dental Service Organisation (DSO) with 50 locations faces a multi-million pound deficit. This is the DSO Multiplier effect. In these larger groups, the cost of an empty dental chair per hour isn’t just an isolated loss; it’s a systemic failure that compounds across every surgery in the network. If each chair loses just one hour a day at an average RPH of £450, a 50-site group with 150 chairs is leaking £67,500 every single day. This scale makes capacity optimization the single most effective lever for driving group-wide EBITDA growth.
Centralised data is the only defense against this invisible profit erosion. Without it, clinical directors can’t identify “High-Leakage” surgeries that are underperforming compared to regional peers. Achieving this level of visibility requires standardising procedures across dental clinics to ensure that every surgery tracks capacity with the same precision. When you standardise the way you measure idle time, you transform a vague operational frustration into a manageable financial metric.
Standardising Chair-Time Valuation
DSOs need a uniform methodology for valuation to make informed investment decisions. Regional hubs often vary in rent, rates, and associate pay, but the core logic for calculating dental chair hourly cost must remain consistent across the organisation. This uniformity allows management to justify investments in healthcare capacity optimization. It shifts the internal conversation from “we feel busy” to “we are 92% efficient.” This data-driven approach ensures that capital is allocated where it can most effectively reclaim lost production time.
Capacity Leakage as a KPI
High-growth DSOs in 2026 are pivoting their reporting structures. Total revenue is a lagging indicator that masks underlying inefficiencies. Utilised Capacity Percentage is the leading indicator that predicts future profitability. Reporting the cost of an empty dental chair per hour directly to the board highlights operational friction that clinicians cannot solve alone. It distinguishes between clinical efficiency, which is how fast the work is performed, and operational efficiency, which is how well the schedule is filled. By treating capacity leakage as a primary KPI, DSOs can move from reactive gap-filling to proactive, automated capacity management.
Reducing the Financial Damage: Proactive Strategies
Quantifying the loss is the first step; stopping the bleed is the second. To mitigate the cost of an empty dental chair per hour, DSOs must deploy a rigorous hierarchy of gap-filling. This framework relies on three pillars: Prevention, Early Detection, and High-Velocity Filling. Relying on manual call lists in 2026 is a tactical error. A receptionist can only make one call at a time, often reaching a voicemail rather than a patient. This manual bottleneck is too slow to counter the immediate financial impact of a late cancellation. You need a system that operates at the speed of your data, not the speed of your staff’s phone skills.
Modern capacity management replaces manual outreach with “Short-Call” automation. When a slot opens, the system should instantly communicate with the patients most likely to fill it. This isn’t just about sending a mass text; it’s about intelligent, targeted outreach that preserves your hourly revenue. High-performing groups use strategies to fill last-minute dental cancellations that leverage patient proximity and treatment urgency to ensure clinical time remains productive.
No-Show Prevention through Predictive AI
Prevention is your first line of financial defense. Generic reminders are no longer sufficient. In 2026, predictive AI identifies high-risk patients by analyzing historical attendance patterns and demographic data before they ever miss an appointment. If a patient is flagged as a high-risk “Failed to Attend” (FTA), the system triggers a more intensive, high-engagement confirmation sequence. This proactive approach reduces the average no-show rate from 15% to under 5%, directly lowering the cost of an empty dental chair per hour by keeping the clinician’s schedule intact. You stop the gap before it creates a hole in your EBITDA.
Last-Minute Gap Filling
When a cancellation is unavoidable, speed is your only currency. “Next-in-Line” notification technology transforms your waitlist from a static document into a high-velocity engine. The moment a surgery slot opens, the system alerts relevant patients who are ready for immediate treatment. This technology can fill gaps within minutes, often before the front desk even realizes the cancellation has occurred. This ensures that every hour of clinician time generates revenue. Every filled slot is a victory over idle capacity. To see how these tools can transform your operations, you can automate your DSO’s capacity management and eliminate the uncertainty of manual scheduling.
TurnUp Front Desk Copilot: Automating Hourly ROI
The financial math is clear. The cost of an empty dental chair per hour represents a structural deficit that manual processes cannot solve. TurnUp Front Desk Copilot provides the definitive solution to this capacity crisis. It functions as a silent, reliable engine that eliminates operational uncertainty across your entire DSO. By providing real-time visibility into capacity leakage, the platform empowers group leaders to move from reactive management to surgical precision. This technology is no longer an optional add-on; it is an essential component of the 2026 DSO technology stack.
Our automated ‘LastMinute’ solution fills gaps without requiring a single phone call from your reception team. It identifies cancellations the moment they occur and initiates high-velocity filling protocols. This shifts the focus from “finding a patient” to “treating the patient.” It transforms the front desk from a call center into a concierge service. The result is a seamless, automated flow of revenue that protects your margins from the volatility of patient behavior. You stop chasing appointments and start managing a high-performance clinical environment.
Recovering Lost Revenue in Real-Time
TurnUp identifies gaps instantly. It doesn’t wait for a staff member to notice a hole in the schedule. By increasing chair utilization by just 3% to 5%, the Copilot drives a significant, measurable impact on practice EBITDA. This recovery happens in the background, allowing your team to focus on the patient experience rather than the stress of a fragmented diary. You stop losing money to the clock and start reclaiming the full value of your clinical hours. The platform ensures that the cost of an empty dental chair per hour is mitigated before it can impact your monthly performance reports.
Data-Driven Capacity Management
Execution requires foresight. TurnUp analytics allow you to forecast future capacity risks and take preventive action before they manifest as empty surgeries. This data-driven approach integrates seamlessly into your existing dental practice management systems, creating a unified ecosystem for growth. You gain the ability to benchmark performance across multiple locations and identify exactly where your group is leaking value. To see these tools in action, you can request a demo of the TurnUp Front Desk Copilot and take control of your organization’s capacity today.
Future-Proof Your DSO Profitability
Capacity leakage isn’t just an operational annoyance; it’s a solvable business challenge that requires surgical precision. We’ve established that the cost of an empty dental chair per hour represents a combination of fixed overhead and lost production that compounds rapidly across multi-site organizations. Manual gap-filling is too slow for the 2026 clinical landscape. Success now requires a shift from reactive scheduling to automated, data-driven capacity management. By implementing specialized DSO reporting and AI-driven no-show prevention, group leaders can transform idle surgery time into consistent EBITDA growth.
It’s time to replace manual bottlenecks with a silent, reliable engine for organization-wide efficiency. Stop losing revenue to empty chairs with TurnUp Front Desk Copilot. Our platform provides automated last-minute gap filling and the visibility you need to optimize every clinical hour. You have the tools to eliminate operational uncertainty and lead your group toward a more efficient, automated future. The path to full capacity starts with one intelligent shift in strategy.
Frequently Asked Questions
What is the average cost of an empty dental chair per hour in the UK?
The average cost of an empty dental chair per hour for a clinician surgery is approximately $527.50. This figure comprises $77.50 in fixed overhead and $450 in lost production value. While hygiene chairs have a lower production rate of $175 to $225 per hour, the cumulative loss remains a significant drain on practice profitability. These figures represent the total financial erosion when a high-value clinical asset remains inactive.
How do I calculate the opportunity cost of a missed dental appointment?
Calculate opportunity cost by adding your hourly fixed overhead to the average revenue that slot would have generated. For example, if your fixed costs are £50 per hour and the scheduled treatment was valued at £400, the total opportunity cost is £450. This represents the actual revenue lost plus the expense of keeping the surgery open and staffed for an empty slot that produces zero returns.
Does a dental no-show really cost more than just the treatment fee?
Yes, a no-show costs more than the treatment fee because it includes the “burn rate” of your fixed overhead. You are still paying for staff wages, rent, and utilities while the chair sits idle. Additionally, there are indirect costs such as administrative friction, reduced staff morale, and the disruption of clinical flow. These factors devalue the practice’s total operational efficiency and create long-term financial drag.
How can DSOs reduce capacity leakage across multiple locations?
DSOs reduce capacity leakage by centralizing data and standardizing capacity metrics across all clinics. Implementing automated platforms allows management to identify underperforming surgeries in real-time. By moving from manual call lists to automated gap-filling, groups can ensure high-velocity responses to cancellations. This strategy transforms a systemic multi-site deficit into a scalable opportunity for EBITDA growth by maintaining a consistent clinical rhythm across the group.
What is a good benchmark for dental chair utilisation rates in 2026?
A target chair utilization rate for a high-performance practice in 2026 is between 80% and 85%. Falling below this threshold indicates significant capacity leakage that erodes profit margins. Well-managed surgeries aim to keep unutilized time to a minimum by leveraging predictive AI to anticipate no-shows. Using automated waitlist backfills ensures that the cost of an empty dental chair per hour is kept as low as possible through constant occupancy.
How does automated gap-filling software improve practice profitability?
Automated gap-filling software improves profitability by instantly connecting available slots with patients ready for treatment. This technology eliminates the manual bottleneck of front-desk phone calls, which often fail to fill short-notice openings. By increasing chair utilization by even 3% to 5%, practices can reclaim thousands in lost revenue. This directly boosts the practice’s bottom line without requiring an increase in marketing spend or clinical hours.
Can predictive AI actually identify which patients are likely to miss appointments?
Predictive AI identifies high-risk patients by analyzing historical attendance patterns, demographic data, and scheduling behavior. Instead of generic reminders, the system triggers targeted confirmation sequences for those flagged as likely to miss their slots. This proactive approach allows the front desk to intervene early. It reduces the average no-show rate from 15% to under 5% across the organization, protecting the schedule from sudden, costly gaps.
What is the difference between fixed and variable costs in a dental surgery?
Fixed costs remain constant regardless of patient volume and include rent, business rates, and staff salaries. Variable costs, such as clinical materials and lab fees, only accrue when a patient is treated. This distinction is vital because the cost of an empty dental chair per hour is driven primarily by persistent fixed expenses. These costs don’t disappear when a patient fails to show, making every empty slot a pure financial loss.