Strong chair utilisation isn’t the same as a full diary. Calculate booked or attended chair hours as a percentage of staffed chair hours; useful dental chair utilisation benchmarks are 75% to 85%, with 85% to 90% an ambitious range for top-performing practices. Above 90%, there’s little slack for urgent or same-day work.
A busy diary can still conceal lost capacity. Booked time doesn’t show how much chair time patients actually use, and a high utilisation percentage alone can’t tell you whether the schedule runs smoothly. Measuring both gives practice leaders a clearer picture.
This article explains the formulas, shows how to compare booked and attended utilisation with benchmark ranges, and explores what the numbers mean for your diary. You’ll also learn how to assess whether a second chair could help, or whether the better opportunity is to recover time already available through more effective scheduling.
Key Takeaways
- Separate booked chair time from attended chair time to see whether gaps come from scheduling or missed appointments.
- Use benchmark ranges as a guide, not a target that forces every chair to run at full capacity.
- Compare production per attended chair hour with schedule demand before deciding whether another chair is the right investment.
- Look for recurring gaps and short-notice cancellations to identify where better capacity management could recover chair time.
How is chair utilisation calculated?
Calculate utilisation by comparing patient chair time with the time chairs are available. Appointment data can also reveal whether gaps stem from cancellations, slot design or workflow delays.
Appointment-book measurement
Appointment-book measurement compares scheduled chair time and attendance records with available capacity. Record patient seat-in and seat-out times for each chair over a consistent period. Use appointment-book data to total booked time and compare it with staffed chair time. Then check attendance records to establish how long patients actually occupied each chair. This helps distinguish empty slots from booked appointments patients miss.
Procedure-based chair blocks
Procedure-based chair blocks assign appointment lengths to treatments, rather than forcing every visit into the same slot. A standard 30-minute booking can misfit procedures of different durations. For example, allow 15 minutes for a check-up, 45 minutes for a filling and 75 minutes for a root canal. Include sterilisation time in the booked service duration, so reception doesn’t schedule another patient before the chair is ready. Better-aligned blocks support a smoother operatory workflow.
A full diary isn’t automatically an efficient one. Don’t target 100% utilisation: overpacking leaves little room for delays or urgent work. An average composite filling takes 35 minutes, so a 60-minute booking can leave 25 minutes unused. That gap can distort production per hour reporting if slot lengths don’t reflect clinical work. Review records by appointment type and adjust blocks where the scheduled duration repeatedly exceeds treatment and turnaround time.
Low utilisation can stem from no-shows, cancellations, mismatched appointment lengths, slow chair turnover or poor operatory layout. Unstructured scheduling and layout can add 8-12 minutes of avoidable cycle time per patient. Track recurring gaps by chair, assistant, equipment and time of day. When dentists share chairs, sequence set-up and treatment deliberately: a dentist can run two chairs by placing anaesthesia and set-up on one, then treatment on the other. Even 10 minutes of turnaround between patients across eight appointments adds up to eighty minutes, so workflow matters alongside booking.
Is a second chair worth the investment?
A second chair makes sense when it can support more productive appointments, not simply increase available capacity. Compare attended chair hours, production and demand before committing.
Chair-hour revenue measures
Revenue per available chair hour divides practice revenue by available chair hours; revenue per chair hour uses the chair-time basis selected for reporting. Keep the denominator consistent when comparing rooms or periods. The available-hour measure shows how capacity earns revenue across opening hours, while occupied-hour revenue focuses on time used for patients. Neither measure alone shows whether a second chair will pay back.
Production by attended chair hour
Production per attended chair hour divides production by the hours patients actually occupied the chair. Compare it with production per provider hour to distinguish unused capacity from differences in appointment mix or provider output. Record production and attended time by dentist, then compare like-for-like clinics, providers and treatment schedules. This makes capacity decisions more useful than relying on a full diary alone.
Manual tracking can begin with a simple record for each chair: available hours, attended hours, production, provider and gaps between patients. Review the same period consistently and recalculate utilisation regularly. Then identify whether the constraint is chair access, patient demand, assistant availability or unproductive turnover. A second chair adds value only if the practice can staff it and fill its usable hours.
UK income per surgery provides context, not a forecast for another chair. Average income per surgery is approximately £142,058 for 100% NHS practices, £161,110 for 80% NHS practices and £224,337 for mixed practices. Predominantly private and fully private practices report around £241,255 and £250,345 respectively. Compare your own incremental production with the additional operating costs before deciding.
For teams needing clearer visibility across chairs and providers, chair utilisation reporting can help expose capacity patterns alongside manual review.
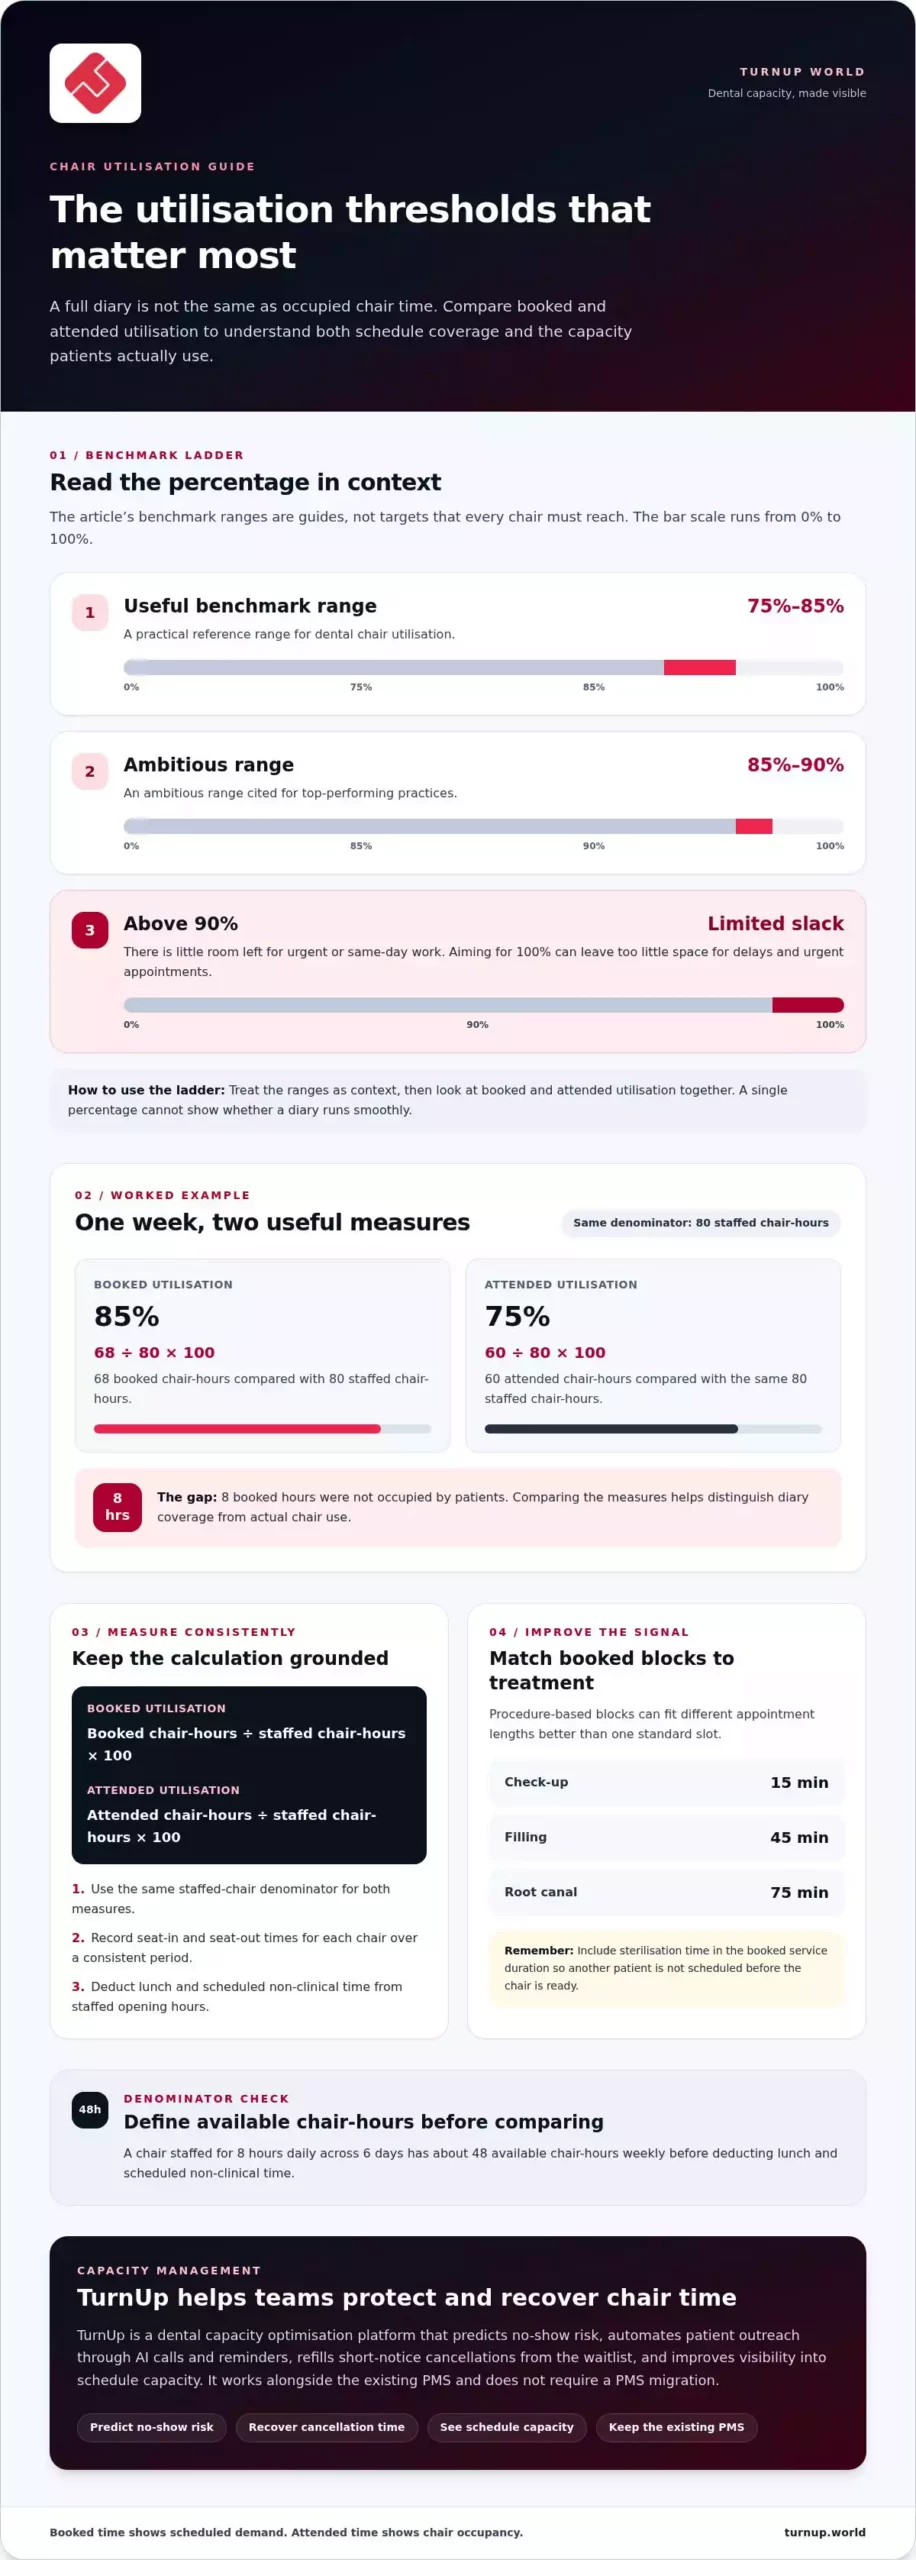
Illustrative booked and attended utilisation calculations
Use the same staffed-chair denominator for both calculations. Booked utilisation shows scheduled demand; attended utilisation reveals how much chair time patients use.
Available and utilised chair hours
Available chair hours are staffed hours open for patient care; utilised hours count patient occupancy. To calculate capacity, total each chair’s staffed opening time, then subtract lunch and scheduled non-clinical time. For example, a chair staffed 8 hours daily across 6 days has about 48 available chair-hours weekly before those deductions. A consistent denominator makes comparisons between rooms meaningful.
Booked and attended utilisation
Booked utilisation equals booked chair hours divided by staffed chair hours, multiplied by 100. Attended utilisation uses attended chair hours instead. In an illustrative week, 80 staffed hours include 68 booked hours and 60 attended hours. The calculations are 68 ÷ 80 × 100 = 85% booked utilisation, and 60 ÷ 80 × 100 = 75% attended utilisation. The 8-hour gap shows booked time patients didn’t occupy. Comparing both measures separates diary coverage from actual use.
Chair utilisation definitions
Chair utilisation measures patient minutes in the chair divided by available chair minutes. Multiply the result by 100 to express it as a percentage. This grounds reporting in actual occupancy, not just a full-looking appointment book. Record seat-in and seat-out times for each chair, then total them over the same period. Keep staffed hours and exclusions consistent, so comparisons reflect performance rather than different counting methods.
Appointment failures and unused time
Cancellations, missed appointments and unused chair time widen the gap between booked and attended utilisation. A cancelled slot left empty may still appear as scheduled time in a diary snapshot, but it contributes no attended time. If reception fills it with another appointment, attended hours can recover. Classify each gap by cause, such as cancellation, non-attendance, late finish or unused block. This breakdown shows why a clinic misses a benchmark and which scheduling issue needs attention.
Dental chair utilisation benchmark ranges
For UK practices, 75% to 85% is a commonly stated utilisation benchmark; top practices aim for 85% to 90%. The useful comparison depends on whether you measure booked or attended chair time.
Benchmark ranges
A benchmark range is a reference percentage for comparing chair use, not a universal operating target. Established practices commonly use 75% to 90% as a healthy range, while 85% to 90% represents a higher utilisation aim. Above 90%, schedules become very tight, leaving little capacity for urgent or same-day appointments. Treat 100% as no ideal: a dental practice needs room for delays and changing patient needs.
Variation by practice and specialty
Utilisation varies with practice size, provider mix, appointment types and how each clinic records available chair hours. Newer or single-doctor practices commonly fall within 60% to 75%; this is a comparison point, not a reason to copy another practice’s target. Specialty workflows also differ: longer procedures occupy chairs differently from check-ups or recall visits. Compare like-for-like chairs and providers before interpreting a percentage.
To make the comparison useful, calculate booked and attended utilisation separately, then review each figure by chair and provider. A 78% attended rate may sit within the established-practice range, yet recurring gaps on one chair can still signal unused capacity. Conversely, 91% can indicate a tightly booked schedule rather than efficient running, especially if the clinic has little room for urgent work.
Practice size alone doesn’t determine the right benchmark. A multi-chair practice may balance demand across rooms, while a smaller clinic depends more on each provider’s diary. Compare equivalent reporting periods and treatment mixes, then use recall demand, cancellations and open chair hours to explain changes. Percentages are not useful without their denominator and context.
Use chair utilisation insights to bring schedule capacity patterns into focus across practice locations.
TurnUp World: Dental capacity optimisation platform for dental practices and multi-site DSOs
TurnUp World helps dental teams protect chair time with clearer insight into schedule capacity. Its platform predicts no-show risk, automates appointment confirmation, cancellation and rebooking through AI calls, and supports short-notice cancellation recovery with waitlist management.
Consider TurnUp when missed appointments or limited capacity insight make it harder to keep chairs filled and scheduling operations efficient. Its AI Call Center supports appointment confirmation, cancellation and rebooking. TurnUp works alongside your existing PMS, with no migration required.
To discuss how TurnUp could support your practice’s capacity management, contact TurnUp World.
Turn insight into a more resilient schedule
Turn measurement into a regular operating habit. Review where chair time is lost, identify patterns your team can influence, and assign someone to follow up. Actions might include refining appointment blocks, improving cancellation response or aligning staffing with demand. Focus on decisions, not percentages alone.
Use dental chair utilisation benchmarks as a reference, then assess progress against your practice’s needs. Consistent reviews help leaders see whether changes improve access, workflow and the use of clinical capacity. They also give teams a shared basis for discussing scheduling priorities.
If you want to explore practical ways to improve capacity management, contact TurnUp World to discuss your practice. A clearer view of chair time can help your team make its next scheduling decision with confidence.
Frequently Asked Questions
Does hiring more staff automatically raise utilisation?
Not necessarily. Hiring more staff raises utilisation only when staffing limits the clinic’s ability to use existing chair capacity. If patient demand is the constraint, additional staff won’t fill empty appointments. An assistant may help a dentist keep treatment flowing between rooms, for example, but extra reception cover alone won’t resolve diary gaps caused by cancellations. Identify the bottleneck first, then match staffing changes to it.
Does sterilisation time count as utilisation?
Sterilisation time isn’t patient-occupied chair time, so keep it separate from attended utilisation. However, include the turnaround in the booked service duration so reception doesn’t schedule the next patient before the chair is ready. If cleaning and preparation follow treatment, for example, the appointment block should protect that time. This gives the team a realistic view of patient use and operational readiness.
Does utilisation differ between branches?
Yes. Branch figures can differ because of appointment demand, provider schedules, treatment mix and opening patterns. Compare branches using the same rules for available and occupied chair time, then investigate differences rather than ranking sites on percentages alone. A branch with more longer procedures, for example, may show a different pattern from one focused on routine appointments. Review each site in the context of its schedule.
Should I track utilisation the same way for a senior dentist and a new associate?
Use the same calculation rules, but report each dentist separately. This keeps the measure consistent while showing whether appointment mix, diary design or chair access affects the result. A senior dentist and a new associate may have different schedules or treatment patterns, so compare each person’s performance over time as well as across the practice. Keep staffed chair hours and reporting periods consistent for fair comparisons.
What is a good utilisation rate?
A commonly cited range for established practices is 75% to 90%, with 85% to 90% an ambitious target. Newer or single-dentist practices may commonly sit at 60% to 75%. Judge your result using attended utilisation and the schedule’s ability to accommodate delays or urgent work. A percentage alone can’t tell you whether capacity is being used productively or the diary is simply overpacked.
What is dental chair utilisation and how is it calculated?
Dental chair utilisation is the proportion of available chair time used for patient care. Calculate it by dividing attended chair hours by staffed available chair hours, then multiplying by 100. Keep booked utilisation separate: it uses booked hours in the numerator instead. For example, a clinic can compare both measures to see whether its gap reflects unfilled appointments or booked visits that weren’t attended.